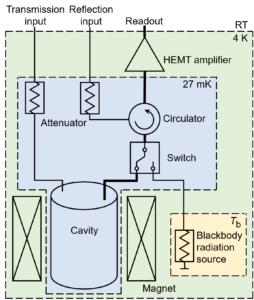
The simplified diagram of the TASEH apparatus

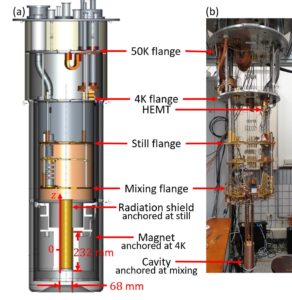
(a) The schematic diagram of the TASEH cryogen-free dilution refrigerator system, (b) An overview photo of the TASEH experimental setup.

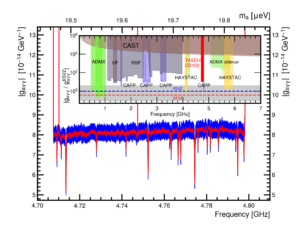
The 95% CL limits on |gaγγ| and the ratio of the average limit with respect to the KSVZ benchmark value from the CD102 data
(red band in the inset). The results from the previous searches performed by the ADMX, CAPP, CAST HAYSTAC, RBF, and UF Collaborations are also shown (inset). The blue error band indicates the systematic uncertainties. The gray band in the inset shows the allowed region of |gaγγ| vs axion mass from various QCD axion models, while the blue and red dashed lines are the values predicted by the KSVZ and DFSZ benchmark models, respectively.